

Published August 27, 2026
Denver & Boulder Housing Market Update | August 2026


August 2026 Market Update: Buyers Took the Leverage, and the Best Homes Never Noticed
The Galvis Group | Smart Strategy. No Hype. | July 2026 MLS data, published
Key Takeaways · July 2026 Front Range Data
- New listings rose in both metros: Boulder up 9.4% to 302, Central Denver up 4.3% to 1,593.
- Homes going under contract fell in both: Boulder down 10.2% to 176, Central Denver down 13.8% to 840.
- Months' supply is above four months in both metros for the first time in 2026: Boulder 4.1, Central Denver 4.5.
- The Boulder median sale price was $882,000, up 0.5% year over year. The Central Denver median was $605,000, up 6.1%.
- The 30-year fixed mortgage rate hit 6.81% the week ending July 31, a one-year high, before easing to 6.65% by August 20.
July is usually the month the Front Range market takes a breath. This year it did something more interesting than that. Supply went up in both metros, demand went down in both metros, and the gap between the homes that sell instantly and the homes that sit got wider than it’s been all year.
That last part is the whole story, and it’s the part the headline statistics hide.
If you only read one thing, here is the August housing market snapshot in 30 seconds:
Buyers gained real leverage in July. New listings rose in Boulder and Denver, contracts fell by double digits in both, and supply is above four months in each metro for the first time this year.
Yet, still, prices haven’t broken. Boulder is up a paltry 0.5% year over year, but Denver is up 6.1%, and both metros are still closing above 97% of original list price, at least on the ones that actually sell. And that’s the secret behind the numbers.
But the market split in two. Well-priced, well-prepared homes in strong locations are still drawing multiple offers in a weekend. Everything else is negotiating on price, on terms, and on inspection.
The cause isn’t a mystery. Mortgage rates climbed to a one-year high during the exact three weeks that July buyers were deciding.
The Numbers at a Glance
July 2026 data, compared to July 2025.
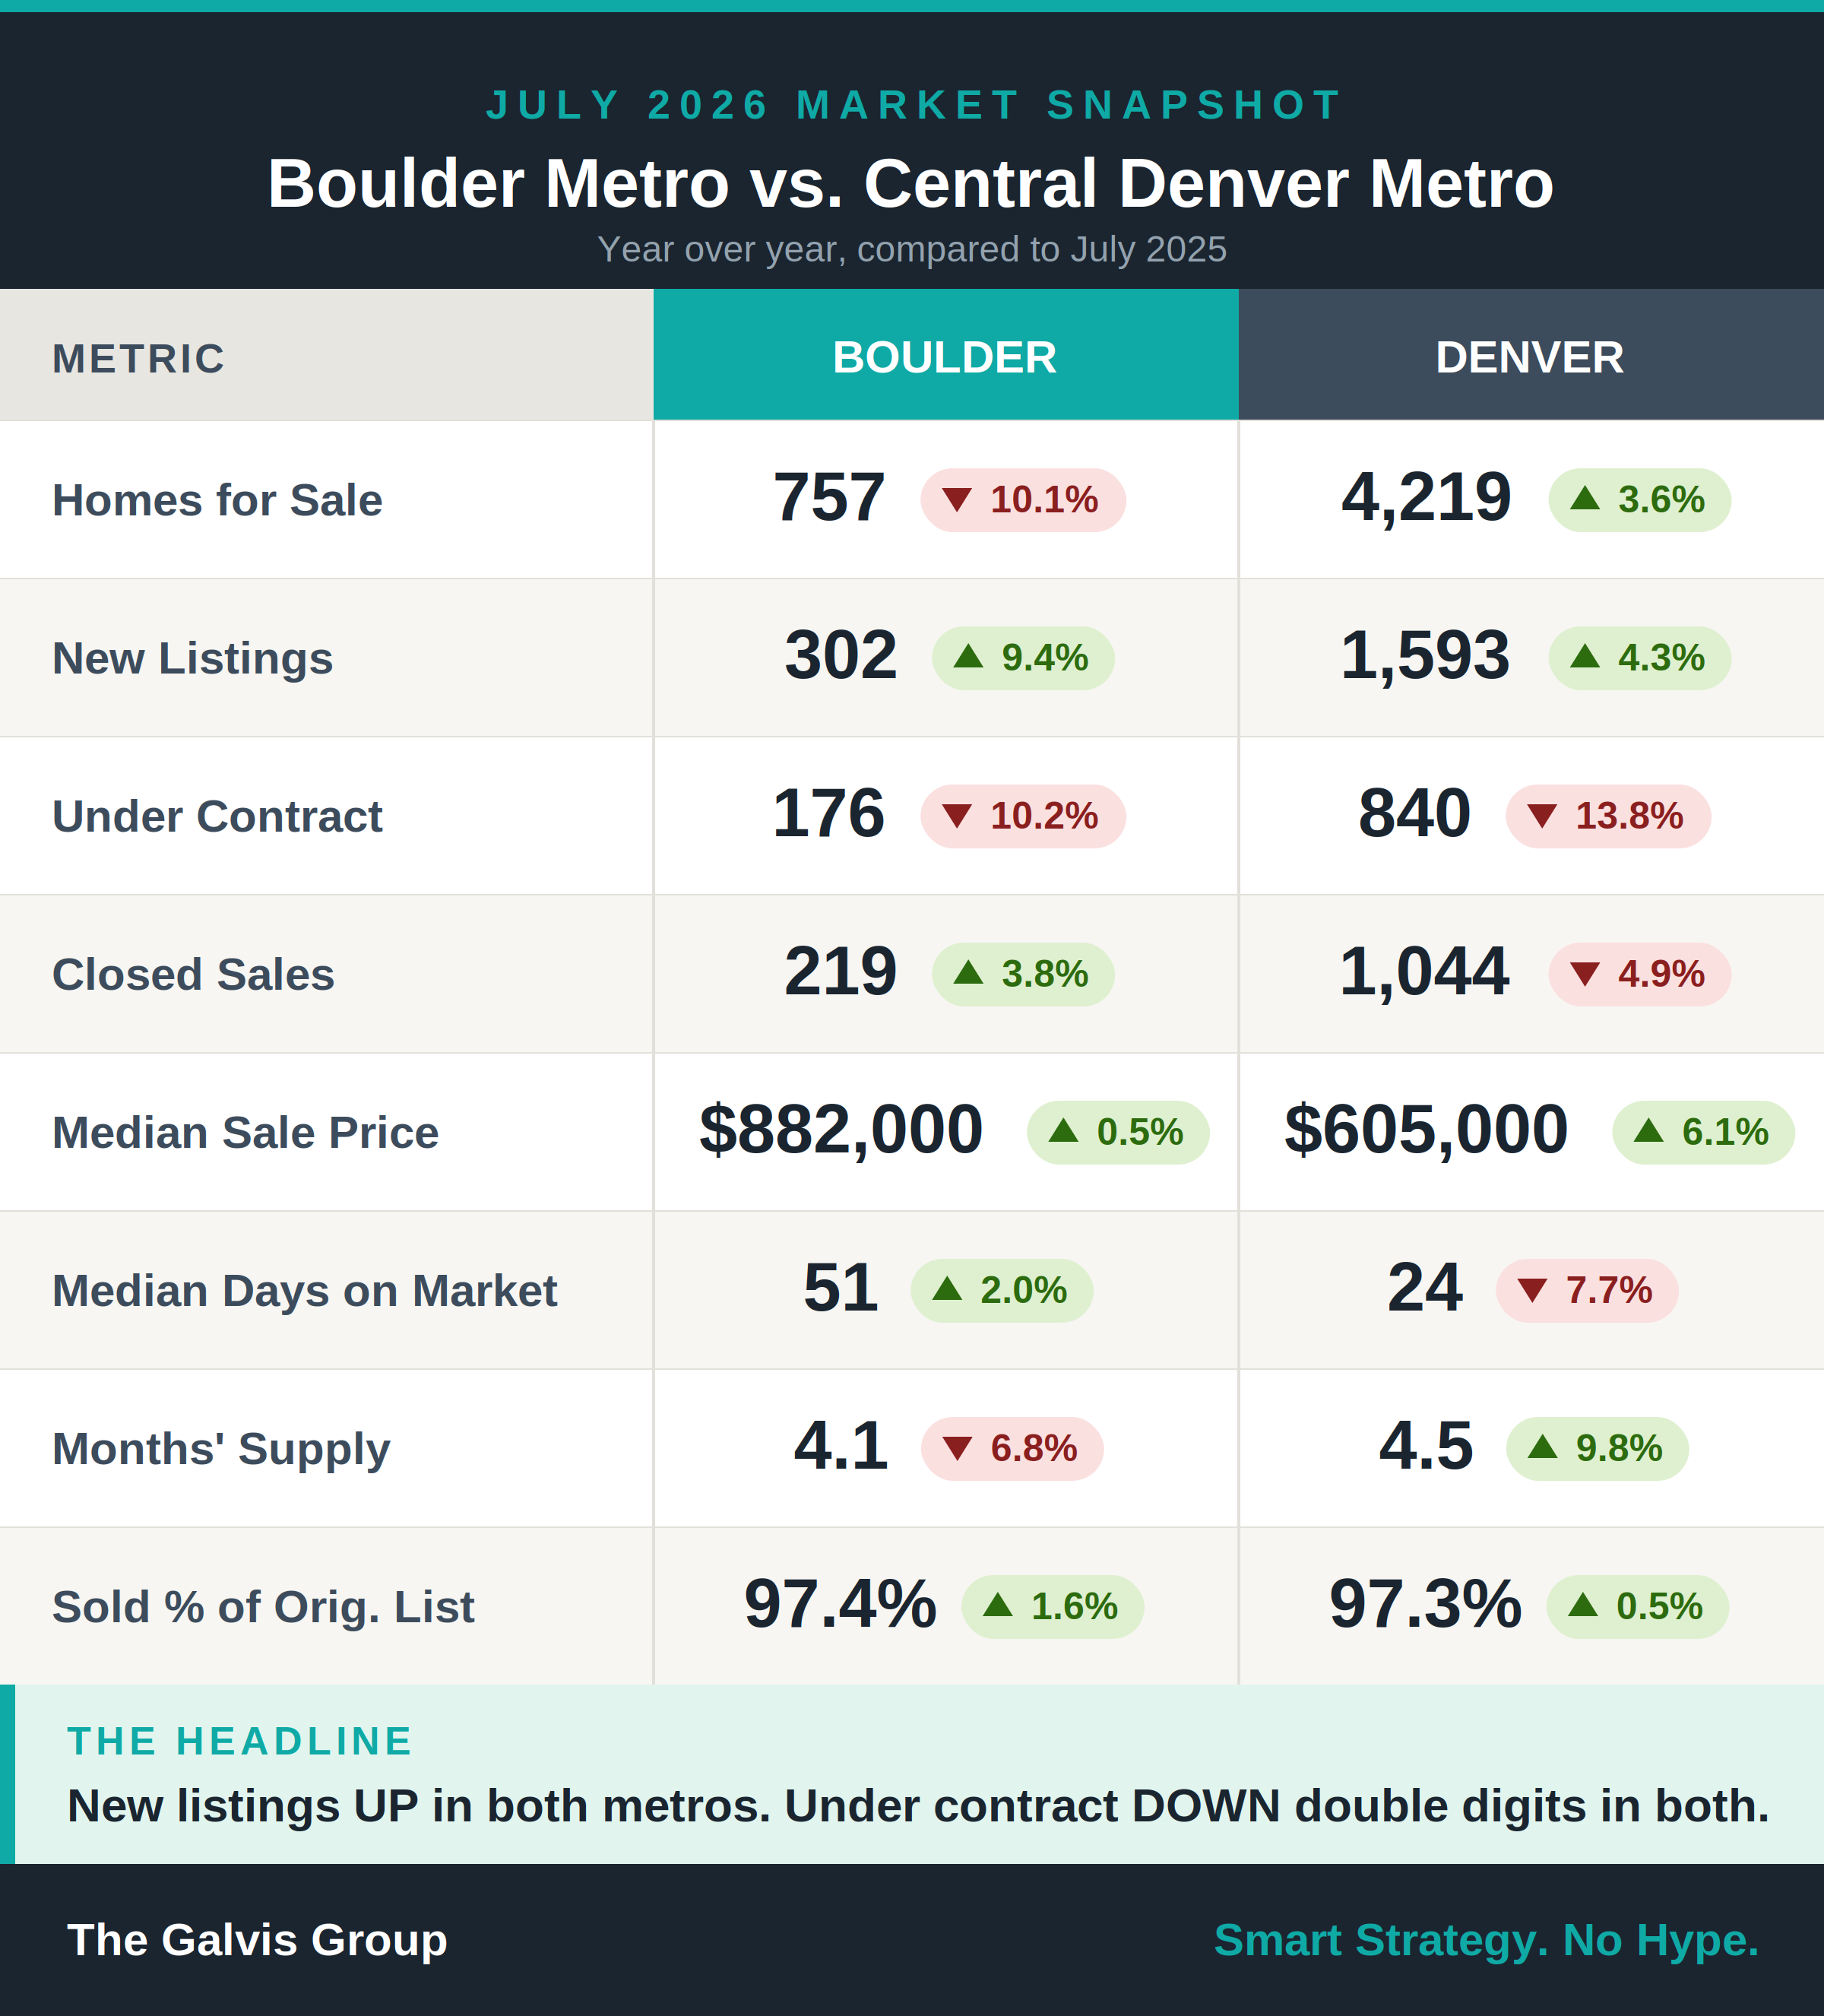
| Metric | Boulder Metro | Central Denver Metro |
|---|---|---|
| Homes for Sale | 757 ▼ 10.1% | 4,219 ▲ 3.6% |
| New Listings | 302 ▲ 9.4% | 1,593 ▲ 4.3% |
| Under Contract | 176 ▼ 10.2% | 840 ▼ 13.8% |
| Closed Sales | 219 ▲ 3.8% | 1,044 ▼ 4.9% |
| Median Sale Price | $882,000 ▲ 0.5% | $605,000 ▲ 6.1% |
| Median Days on Market | 51 ▲ 2.0% | 24 ▼ 7.7% |
| Months' Supply | 4.1 ▼ 6.8% | 4.5 ▲ 9.8% |
| Sold % of Orig. List | 97.4% ▲ 1.6% | 97.3% ▲ 0.5% |
Two lines in that table matter more than the rest. New Listings are up in both metros and Under Contract is down double digits in both metros. Supply is arriving faster than demand is absorbing it, and that’s the mechanical definition of a market handing leverage to buyers.
Reading the Market: One Shift, Two Very Different Metros
Boulder: scarcity without pricing power
Boulder still looks tight on paper. Active inventory is down 10.1% year over year, months of supply fell 6.8% to 4.1, and closed sales actually rose 3.8%. In most years, that combination produces price acceleration.
This year, in Boulder, it didn’t. The Boulder median came in at $882,000, up just 0.5% from a year ago. That’s also down month over month for the second month in a row. Sequentially it’s eased from $915,000 in May and $898,000 in June, as covered in last month’s market update.
That’s the honest read on Boulder right now: the supply is genuinely constrained, but buyers are no longer willing to pay a scarcity premium for it. Scarcity only creates urgency when buyers believe waiting costs them something. With 302 new listings hitting in a single month and a median that hasn’t moved in a year, they aren’t feeling any scarcity at the moment.
One note on that 51-day figure, because it matters. In Boulder, days on market runs all the way to closing, not to contract, so the real time to contract is closer to three or four weeks. That’s why I never lean on that number by itself.
Denver: more inventory, fewer sales, and a faster clock
Denver looks like the opposite market, but it’s still behaving like the same one. Active inventory is up 3.6%, months of supply climbed 9.8% to 4.5, and closed sales fell 4.9%. More homes, fewer buyers.
And yet the Denver median rose 6.1% to $605,000. Plus, median days on market, which in Denver really means days to contract, dropped 7.7% to 24 days. More supply, less demand, higher prices, faster sales. On face value, that doesn’t reconcile.
It only makes sense once you understand what the closed-sales number actually measures. It measures the homes that actually sold. It doesn’t measure the homes that didn’t. When a market splits, the homes that succeed are disproportionately the best-prepared, well-located, correctly priced ones, and they move fast at or near the asking price. The rest accumulate in the active inventory count and never enter the median calculation at all. Denver isn’t getting hotter. Denver is getting more selective, and the selection is flattering the statistics.
The metric nobody is watching
For every 10 homes that came on the market in Boulder in July, roughly 5.8 went under contract. In Denver it was roughly 5.3. Both metros are adding inventory faster than they’re clearing it, and both crossed above four months of supply. Four to six months is the textbook definition of a balanced market. We’re at the buyer-friendly edge of balanced, in both metros, for the first time in this cycle.
The Divergence in One SentenceBoulder is a supply-constrained market that’s lost its pricing power, while Denver is an expanding market whose statistics look strong only because the homes that sell are no longer representative of the homes that are for sale.
Mortgage Rates: A One-Year High Landed in the Middle of July
The cause-and-effect chain here is unusually clean, and it explains the contract numbers better than any local factor.
July opened well for buyers. The 30-year fixed sat near 6.43% in the first week, a seven-week low, and buyers who’d been waiting started touring.
Then the direction reversed. Treasury yields moved higher through the middle of the month. Renewed hostilities in the Middle East pushed oil prices up, which revived inflation concerns. The Federal Reserve held its policy rate steady at its July meeting, but a handful of committee members voted to raise it by a quarter point, which is a materially different signal than a unanimous pause with cuts on the horizon.
By the week ending July 31, the average 30-year fixed rate had climbed to 6.81%, the highest reading in a year.
Now put that timeline against the calendar: a buyer touring in early July was pricing a payment at 6.43%. By the time that same buyer was ready to write, three weeks later, the payment had moved. On a Boulder-median purchase with 20% down, roughly a $705,600 loan, the difference between 6.43% and 6.72% is about $135 a month, or roughly $1,620 a year. On a Denver-median loan of about $484,000, the same swing is about $93 a month.
Now, that is not a catastrophic number. But it is a moving number, and moving numbers make buyers slow down - especially when they’re moving in the wrong direction. July under-contract activity fell 10.2% in Boulder and 13.8% in Denver. That’s what a rate spike looks like when it lands in the middle of a decision window.
Subsequently, rates have come back down. A weaker-than-expected jobs report in early August reduced the odds of an imminent Fed hike. Treasury yields eased, and Freddie Mac put the 30-year fixed at 6.65% as of August 20, down slightly from 6.67% the week before. Daily trackers have the 30-year pinned near the top of a 30-day range of roughly 6.51% to 6.72%.
The takeaway: rates are rangebound between roughly 6.4% and 6.8%, and the Fed has no clean case to cut. Unemployment is at 4.1% and core PCE inflation is running at 3.3%. That is not cutting territory. Every dip toward 6.4% is a window to lock, not the start of a trend, and it’s not a reason to overspend on a rate buydown that won’t pay itself back before you refinance.
What the Data Does Not Show: Notes From the Field
The MLS reports outcomes. It doesn’t report what it took to get them. Here’s what the last four weeks have actually looked like from inside the transactions.
Buyers are taking their time, and they’re asking for more. Inspection negotiations have gotten noticeably more aggressive across most of the Front Range. Buyers who would have absorbed a deferred-maintenance item in the last few years are now asking sellers to fix it, credit it, or watch them walk.
One recent buyer purchase of mine in Broomfield is a good illustration of the ceiling on that leverage. Those buyers ended up with a new sewer line, a new roof, and substantial grading and drainage work, all negotiated after inspection, and totaling around $40,000. In 2021 that list would have been laughed out of the room. Plus, they’d have had to pay 8% to 10% more just to get that same place under contract to begin with. Sure, their rate is higher than they’d like today, but they’ll refinance the rate. They’ll never refinance the price they paid or the work they got done at the seller’s expense. The equity position that combination creates is genuinely excellent.
Now the other side of the same weekend. Those same buyers offered on a house down in Arvada. That home drew seven competing offers, and my buyers didn’t have the appetite for a bidding war. They improved their initial offer once, and still lost. Same weekend, same buyers, same market. That is not a contradiction. That is the split.
The pattern is consistent: the best-positioned homes, in the most desirable pockets, that were prepared properly before they hit the market, are still selling with competition. Everything short of that is sitting, and the sellers are making up the difference in price, terms, and inspection concessions. It comes back to what actually causes homes to sell.
Showing volume is the leading indicator I’m watching most closely. I have two listings that launched last week. Both had near misses on their first weekend, which tells me the pricing is close to right. But the raw number of showings has been low, and low showing counts with near misses is the signature of a market with buyers who are engaged but not urgent.
The investor side is even more striking. My duplex listing at 1434 12th Avenue in Longmont is at a 6.4% cap rate, with almost no vacancy over the last five years and tenants on both sides who want to renew and stay. Numbers like that used to move in a couple of days. It didn’t sell last weekend, and investors aren’t exactly drowning in alternatives right now. That is not a pricing problem. That is genuine sluggishness.
Warren Buffett’s line applies squarely here: “Be fearful when others are greedy and greedy when others are fearful.” Right now homebuyers are the greedy party and investors are the fearful one. Historically, that’s backwards, and historically it doesn’t last.
What This Means for Buyers
Boulder Buyers
You have more negotiating room than you’ve had in this cycle, and less selection than you’d like. Both are true at once. Months of supply is at 4.1 and the median has been flat for a year, which means the market probably isn’t going to punish you for taking a week or two to decide on the average listing.
However, the exception matters here more than the rule. The genuinely well-positioned homes, the ones in the good pockets that were prepared correctly and priced right, are still drawing competition and will disappear if you don’t act quickly. When you see a home you like, you have to know which category it falls into before you decide how quickly to act or how hard to push. Pushing hard on the wrong house is how you lose the right one.
On inspection, ask for what you actually need. Sellers are saying yes to things they wouldn’t have entertained even earlier this year, and repairs negotiated now are permanent value you don’t finance.
Denver Buyers
Denver gives you the most selection, yet the fastest clock on the good stuff. Months of supply is at 4.5, but median days on market is 24. Those two numbers describe a market with a large slow tier and a small fast one.
Practically, that means your search strategy should be split. On aging inventory, negotiate hard on price and terms. On a fresh, correctly priced listing in a strong location, move at the pace of the listing, not the pace of the headline. The 6.1% year-over-year gain in the Denver median came from that second group, not the first. You can see what’s currently available across Boulder and Denver here.
Both Metros
- Get fully underwritten, not just prequalified. Even in a slow market, a clean file is still a negotiating asset.
- Price a rate lock rather than a rate forecast. The Fed is discussing hikes, not cuts.
- Don’t buy down the rate aggressively. If the buydown won’t pay itself back before you’d realistically refinance, put that money into the price or into the repairs instead.
- Use the inspection period fully. It’s currently the highest-leverage part of the contract.
What This Means for Sellers
Boulder Sellers
Boulder’s inventory constraint is real and it’s working in your favor, but it isn’t doing the job it used to do. A 0.5% annual gain says buyers will wait you out. The scarcity isn’t creating urgency on its own anymore.
What creates urgency is a launch that’s genuinely correct on day one. The market is closing at 97.4% of original list price, which means the typical Boulder seller is leaving roughly $22,900 on the table relative to their original ask. That is not a market condition. It’s almost always a pricing decision made before the sign went in the yard. Here’s how I prepare a listing before launch.
For context, my own listings sold this year have averaged 99.8% of original list price with no price reductions. On an $882,000 home, that 2.4-point difference is about $21,000. Same market. Different launch.
Denver Sellers
Denver rewards preparation more sharply than any market I’ve worked in recently. The homes going under contract are doing it in 24 days at 97.3% of original list. The homes that aren’t prepared are joining an ever-growing pool of active inventory that increased 3.6% year over year, and they’re being used by buyers as leverage against everyone else.
With supply climbing and contracts down 13.8%, aspirational pricing is the single most expensive mistake you can make right now. There’s no scarcity to bail you out. Your first two weekends are the entire negotiation, and everything after that is a discount conversation.
Both Metros
- Prepare before you launch, not after. Pre-inspect, address the obvious items, and remove the buyer’s ammunition before they load it.
- Budget for concessions. Assume a real inspection negotiation and price the house so you can absorb one.
- Flexibility on terms is currently worth more than flexibility on price. Rate buydowns, closing cost credits, and possession timing are all moving deals forward.
- Watch your showing counts first, and read the feedback against them. Low showings with near misses means price is close. High showings with no offers means the house isn’t showing the way the photos promised.
For Homeowners Not Planning to MoveBoulder homeowners are roughly flat on paper year over year at an $882,000 median, while Denver homeowners gained about 6.1% to $605,000. Neither market is losing value. If you’ve been weighing a move-up, a downsize, or pulling equity for an investment, current conditions favor being the buyer more than being the seller, which is worth modeling if you’d be doing both at once.
The 30-Day Projection
Rates: Expect the 30-year fixed to hold between roughly 6.4% and 6.8%. The Fed meets on September 16 with a hike genuinely on the table, which is a different posture than the market spent most of the last two years pricing. Any move toward 6.4% is a lock opportunity, not a signal to wait for more.
Closed sales: This is the most confident call I can make. July’s under-contract numbers fell 10.2% in Boulder and 13.8% in Denver, and those contracts become August and September closings. Expect the next two monthly reports to print weak closed-sales numbers in both metros. That’ll generate some alarming headlines. It is a rate spike working through the pipeline, not a collapse in demand.
Inventory: Denver should keep building through the post-Labor Day listing wave before thinning out in November. Boulder should stay roughly flat, with the constraint intact and the seasonal drop arriving on schedule in late fall.
Prices: Flat to modestly lower medians in both metros through the fall, with year-over-year comparisons staying positive. Nothing in this data suggests a price break. It suggests a stall.
The wildcard: The inflation prints. Core CPI last read 2.8% and core PCE is at 3.3%. A hot September reading pushes rates back toward 6.9% and freezes the fall market. A cool one pulls rates toward 6.4% and unlocks a genuinely good fall buying window for anyone who’s prepared to move quickly when it opens.
The One-Line SummaryBuyers have leverage for the first time in years, but only on the homes that allow it. If you’re buying, know which kind of house you’re standing in. If you’re selling, the launch is the entire strategy.
Frequently Asked Questions
Is Denver a buyer’s market right now?
Denver is at the buyer-friendly edge of a balanced market. Months’ supply reached 4.5 in July 2026, up 9.8% year over year, and four to six months is the standard definition of balance. Buyers have real negotiating room on aging inventory, but well-prepared homes in strong locations still go under contract in about 24 days.
Are home prices falling in Denver and Boulder?
No. Year over year, the Central Denver median rose 6.1% to $605,000 and the Boulder median rose 0.5% to $882,000. Boulder has eased month to month from $915,000 in May and $898,000 in June, which is a seasonal pattern rather than a decline in value.
What is the median home price in Boulder, Colorado?
The Boulder Metro median sale price was $882,000 in July 2026, up 0.5% from July 2025. The Central Denver Metro median was $605,000, up 6.1%.
Why are homes sitting on the market in Denver?
The market has split in two. Homes that were correctly priced, well prepared and well located still sell quickly and near asking price, while everything else accumulates. Both metros closed near 97.3% of original list price in July, and inventory is building faster than it is clearing.
What are mortgage rates doing in August 2026?
The 30-year fixed rate climbed to 6.81% the week ending July 31, 2026, a one-year high, then eased to 6.65% by August 20 after a weaker-than-expected jobs report. Rates are rangebound between roughly 6.4% and 6.8%, and the Federal Reserve has no clear case to cut with unemployment at 4.1% and core PCE inflation at 3.3%.
Should I sell my house in Boulder this fall?
It depends more on your launch than on your timing. The typical Boulder home sold at 97.4% of its original list price in July 2026, roughly $22,900 below the original ask. That gap is almost always a pricing decision made before listing, not a market condition.
About The Galvis Group
I’m Stu Galvis, a fourth-generation broker in my 22nd year in the business. I’ve closed more than 850 transactions from Boulder to Denver, and spent nearly two decades training and coaching other brokers, locally, regionally, and nationally. That’s a long way of saying I’ve spent a lot of time studying what actually causes homes to sell and what doesn’t.
This report exists because most market commentary is either a cheerleading exercise or a scare tactic, and neither one helps you make a decision. The numbers are the numbers. What matters is what you do with them.
If you’re weighing a move in the next 6 to 12 months, in either direction, the current market rewards planning more than it rewards timing. I’m happy to run your specific numbers with you, with no expectation attached.
Data source: Boulder Metro and Central Denver Metro MLS statistics for July 2026, year-over-year. Mortgage rate data from Freddie Mac PMMS, the Mortgage Bankers Association, and daily rate trackers as of August 24, 2026. Rate and payment figures are illustrative and are not a loan offer.